


Organic traffic is down. Impressions are up. Rankings barely moved. And now your boss, your board or your client wants to know what happened.
“AI Overviews” is probably the right answer. It also sounds exactly like an excuse.
You’re not the only one stuck on this. Someone reached our site by searching: “we need to report ai search visibility to the board each quarter – what software produces those numbers?” A thread on r/SEO this October asked the agency version: how do you explain to clients that traffic dropped because of AI Overviews, and do they actually get it?
You need three things: a way to prove the drop is AI and not you, a short explanation that holds up, and an AI visibility report built on numbers anyone in the room can check.
Key Takeaways
Impressions and clicks have split apart. BrightEdge reported impressions up more than 49% since AI Overviews launched, while click-throughs fell nearly 30%.
The click loss is real, but its size is contested. Ahrefs estimates a 58% lower CTR for the top result when an AI Overview shows, Seer Interactive saw AI Overview CTR partly recover in early 2026, and Google says total clicks are "relatively stable."
Rule out everything else first. A drop with steady rankings, steady impressions and losses only on queries that show an AI Overview points to AI. A drop across the board points somewhere else.
Report clicks, not CTR. Inflated impressions can cut sitewide CTR in half while clicks hold, so CTR belongs on page-level reports only.
Search Console shows AI impressions, not AI clicks. Its generative AI report reached every site on August 31, 2026, with impressions only.
Every number in the report should name its source. Search Console, GA4 and a fixed prompt set cover most of it for free.
Why Traffic Drops While Impressions Don't
Google AI Overviews answer the question at the top of the search results. Your page can be cited in that answer, counted as an impression, and never clicked.
That’s how Search Console counts it. According to Google’s help documentation, standard impression rules apply to AI Overviews, every link inside an AI Overview gets the same position, and only a click to your page counts as a click. In AI Mode, Google’s chat-style search, each follow-up question counts as a brand-new query with its own impressions.
So you get more impressions and the same or fewer clicks. Search people started calling this “the great decoupling.”
BrightEdge and Seer Interactive both measured it:
- BrightEdge (May 14, 2025): impressions across its data grew more than 49% since AI Overviews launched, while click-throughs fell nearly 30% since May 2024.
- Seer Interactive (April 24, 2026): for brands cited in AI Overviews, impressions more than doubled from September to October 2025 (15.8 million to 33.1 million) while clicks barely moved (398,000 to 400,000).
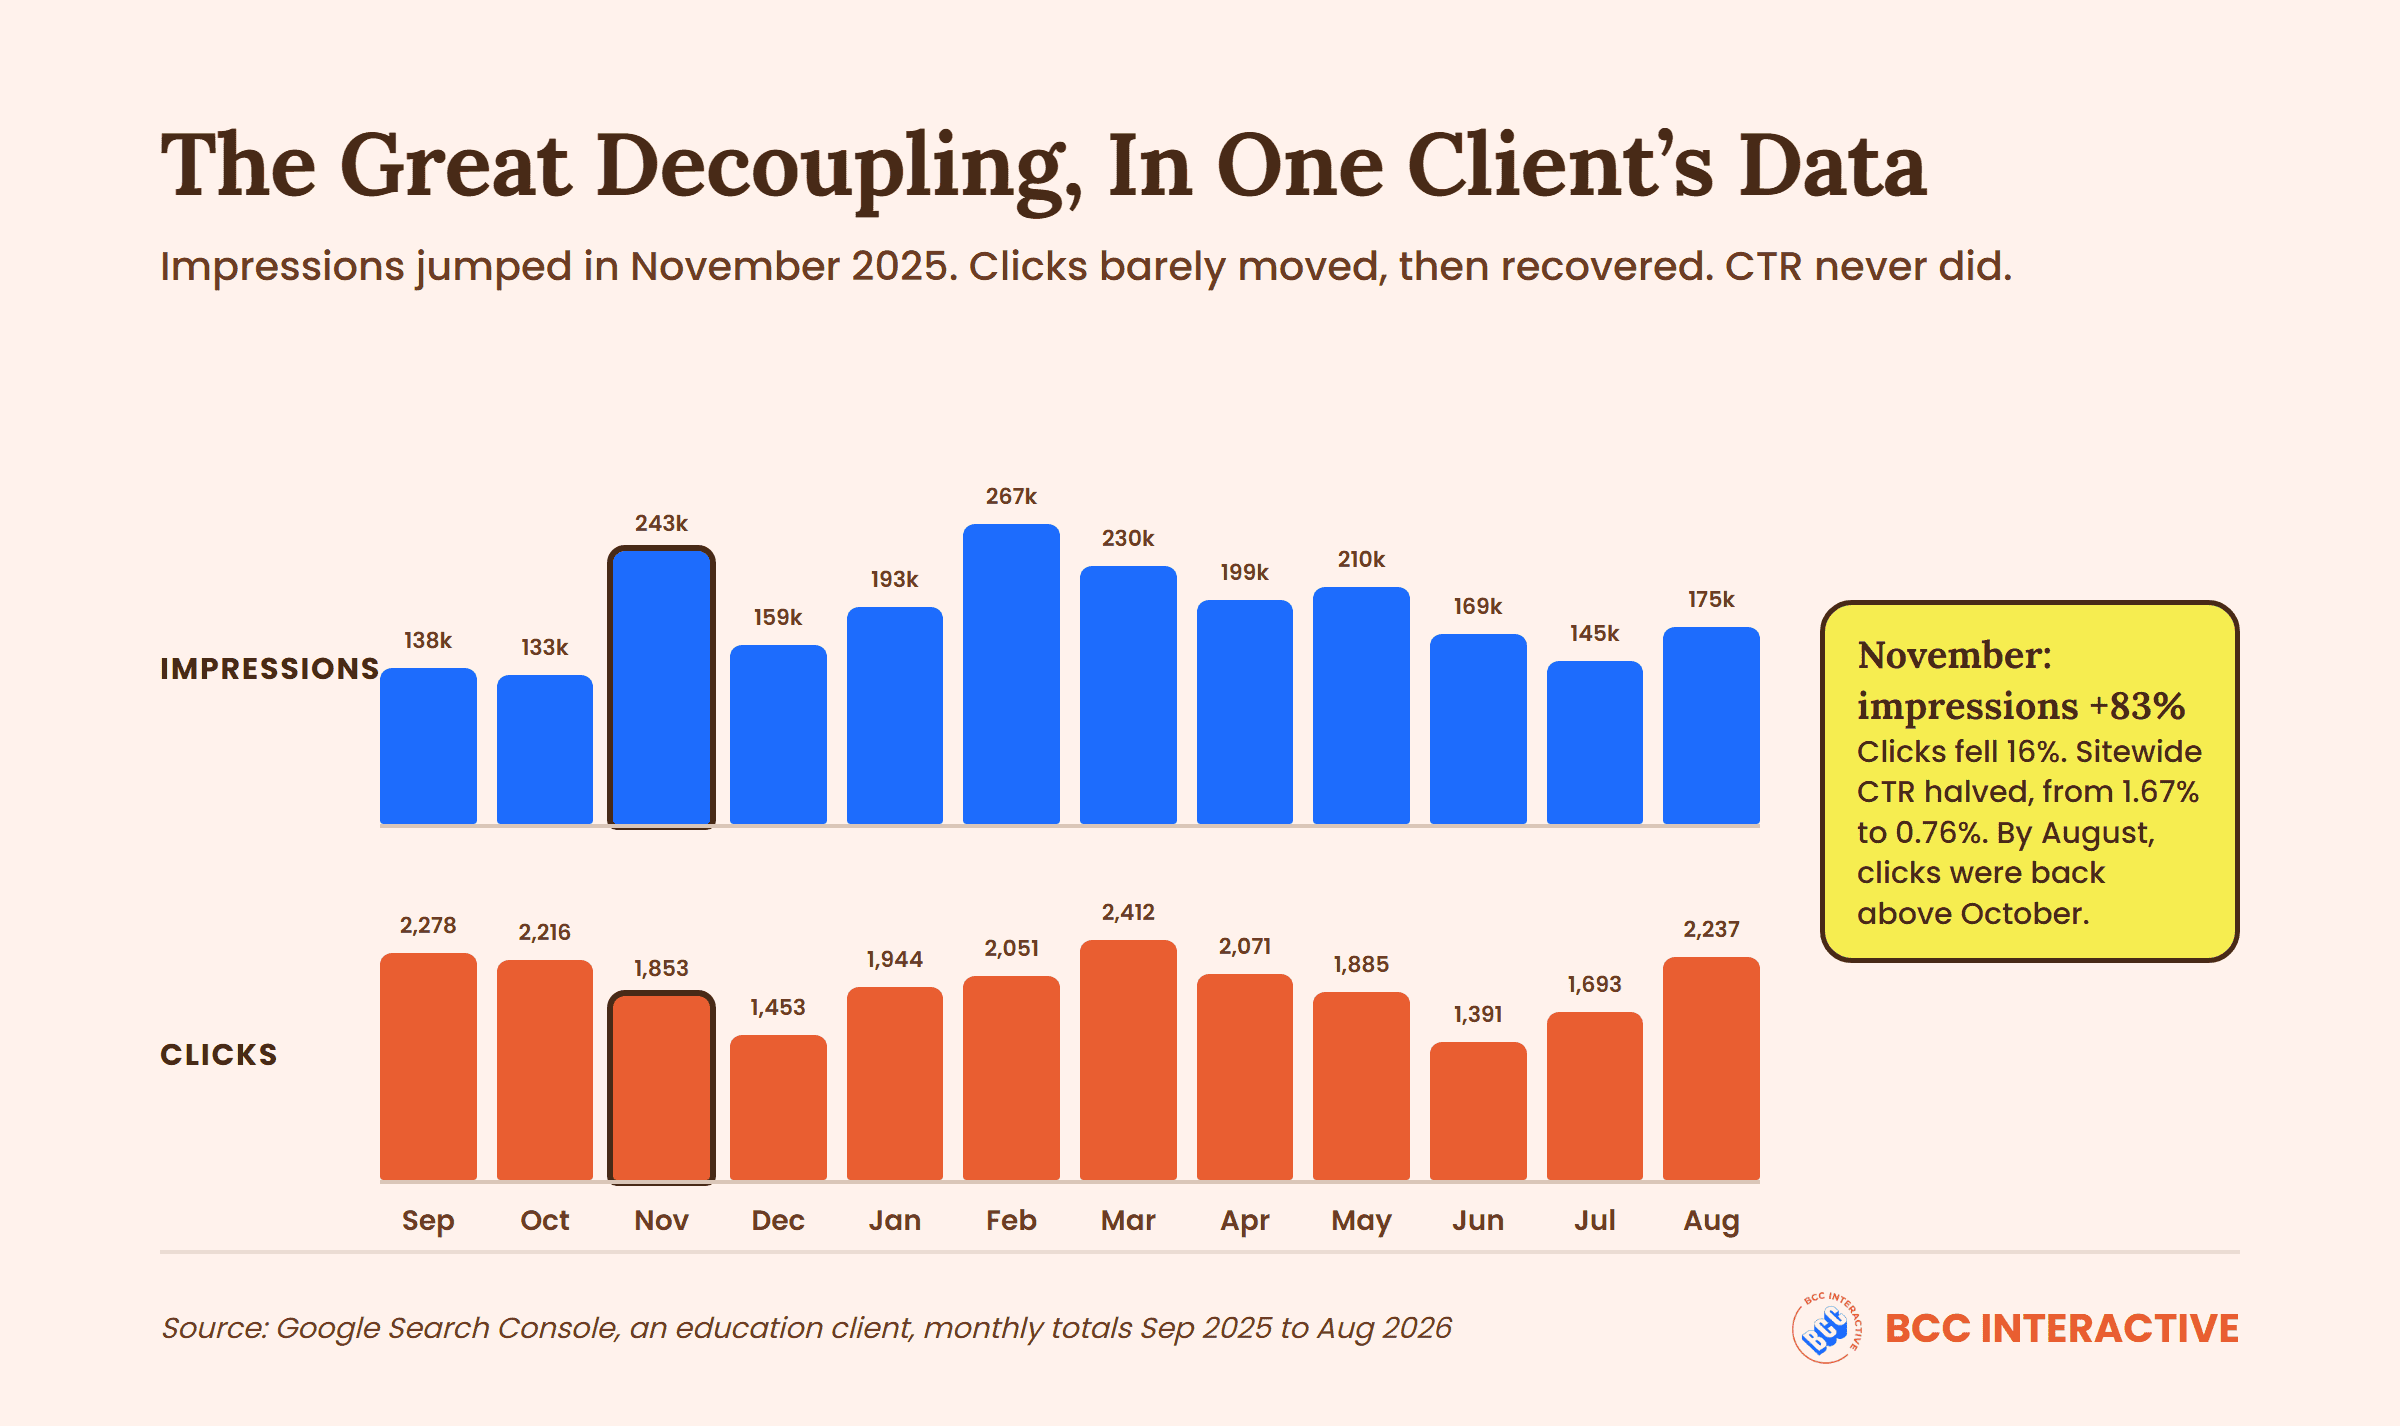
We saw the same pattern with an education client. In November 2025, their Search Console impressions jumped from 132,567 to 242,531 in one month. Clicks dipped from 2,216 to 1,853, and sitewide CTR (click-through rate, the share of impressions that turn into clicks) fell from 1.67% to 0.76%.
Clicks have since recovered, to 2,237 in August 2026. CTR never came back; it sat at 1.28%. The extra impressions came from short definitional queries ranking in positions 1 to 6 with zero clicks, plus prompts people pasted from AI tools. Nothing about the site got worse.
If that client’s report had led with CTR, it would have shown a collapse that never happened.
What The Research Says About The Impact Of AI Overviews On Clicks
Leadership will ask whether this is happening to everyone. The answer is yes, but nobody agrees on how much.
| Study | Published | Sample | What it found |
|---|---|---|---|
| Ahrefs | April 17, 2025 | 300,000 keywords, desktop Search Console data, March 2024 vs. March 2025 | Top result's CTR about 34.5% lower when an AI Overview shows |
| Ahrefs (update) | February 4, 2026 | Same 300,000-keyword design, December 2023 vs. December 2025 | Top result's CTR about 58% lower |
| Pew Research Center | July 22, 2025 | 900 US adults, 68,879 Google searches in March 2025 | People clicked a regular result on 8% of visits with an AI summary vs. 15% without one |
| Amsive | April 16, 2025 | 700,000 keywords across 10 websites in 5 industries | CTR down 15.49% on average; non-branded down 19.98%; branded up 18.68% |
| Seer Interactive | April 24, 2026 | 53 brands, 5.47 million queries, 2.43 billion organic impressions | Organic CTR on AI Overview queries fell to 1.31% in December 2025, then rose to 2.36% by February 2026 (3.82% without an AI Overview) |
| Google (Liz Reid, Head of Search) | August 6, 2025 | No data published | Total organic clicks "relatively stable" year over year, with more "quality clicks" |
The direction is consistent. Every independent study above found fewer clicks when an AI Overview shows, especially on non-branded, informational searches.
The size is not. Ahrefs went from 34.5% to 58% depending on the comparison window, and its method estimates what CTR would have been without AI Overviews rather than measuring it directly. Seer’s newest data shows AI Overview CTR climbing back in January and February 2026, though still below queries without one.
The exceptions matter. Amsive found branded searches gained clicks when an AI Overview appeared. Seer found brands cited in the AI Overview got about 120% more organic clicks per impression than brands that weren’t cited, while still trailing queries with no AI Overview. Google says total clicks are steady but hasn’t published the numbers to check that.
Give your boss the range and the reason it’s a range. Picking the scariest number makes you look like you’re hiding behind it.
First, Rule Out Everything That Isn't AI
Before you blame AI Overviews, prove it. Half the credibility of this conversation comes from showing you checked.
| What you see | Likely cause | How to check |
|---|---|---|
| Clicks down, impressions flat or up, average position steady | AI Overviews or other search features answering the query | Split queries into ones that show an AI Overview and ones that don't. If only the first group lost clicks, it's AI |
| Clicks and impressions both down | Lost rankings or less demand | Compare position by query, then check search demand for the same months last year |
| Clicks down on every page at once, including branded | Tracking or technical problem | Confirm GA4 and Search Console agree, and check indexing and recent site changes |
| Drop lines up with a date | Google update, redirect or migration | Check Google's update history and your own change log |
| Same drop at the same time last year | Seasonality | Compare to the same 28 days last year |
The split test in the first row does most of the work. Take your informational queries, sort them by whether an AI Overview shows (your AI Overview tracking or a manual check tells you), and compare clicks for each group. If only the AI Overview group fell, you have your answer. If both fell, the problem is rankings, and you need to say so.
Watch your comparison windows too. Comparing the last 28 days to the 28 days before hides slow declines, because each window looks only slightly worse than the last. We compare the last 28 complete days to the 28 days that ended 90 days earlier, plus the same 28 days last year for seasonality.
Why We Report Clicks, Not CTR
We make the same call for every client.
CTR used to be a decent health check. Now AI surfaces and pasted prompts can double your impressions in a month without sending a single extra visitor, and sitewide CTR drops even when nothing is wrong. Put that number in a leadership deck and you’ll spend the meeting defending a decline that isn’t one.
So the report leads with clicks and key events (the conversions GA4 tracks, like form fills, calls and purchases). Those track business value. Impressions go in as context, with a note on the chart anywhere they jump without matching clicks.

Report clicks and key events at the top, and keep CTR off the sitewide summary. Use CTR only page by page, for pages ranking in the top 10, where it still tells you something about your title and snippet. Sitewide CTR now measures how many zero-click impressions Google shows you, not how well your SEO works.
What To Say: The Three-Sentence Explanation
Most people don’t need a lecture on large language models. They need to know three things: what happened, whether it’s your fault, and what you’re doing about it.
Paste This Into The Email Before The Meeting
- Our organic traffic fell [X%] this quarter while our impressions rose [Y%] and our rankings held, because Google now answers more of these questions directly in AI Overviews, so people see us without clicking.
- The drop is concentrated on [informational / how-to] searches; clicks on the pages that bring in [leads / sales / bookings] are [steady / down Z%], and key events are [number].
- We're shifting effort toward the searches where people still click and buy, and we're tracking how often AI answers cite us, starting with a baseline this month.
Sentence one names the cause with your own numbers, sentence two separates lost research traffic from lost revenue, and sentence three answers "so what are we doing about it" before anyone asks.
Talking To Your Boss
Your boss wants to know if the program still works. Lead with key events and pipeline, then show the split test: AI Overview queries lost clicks, the rest didn’t. Bring one Search Console chart with impressions and clicks on the same axis and the structural break annotated.
If leads held while traffic fell, say that plainly. The lost clicks were mostly research traffic that rarely converted.
If leads fell too, say that plainly as well, and bring a plan. Don’t let “AI Overviews” carry a decline it didn’t cause.
Talking To The Board
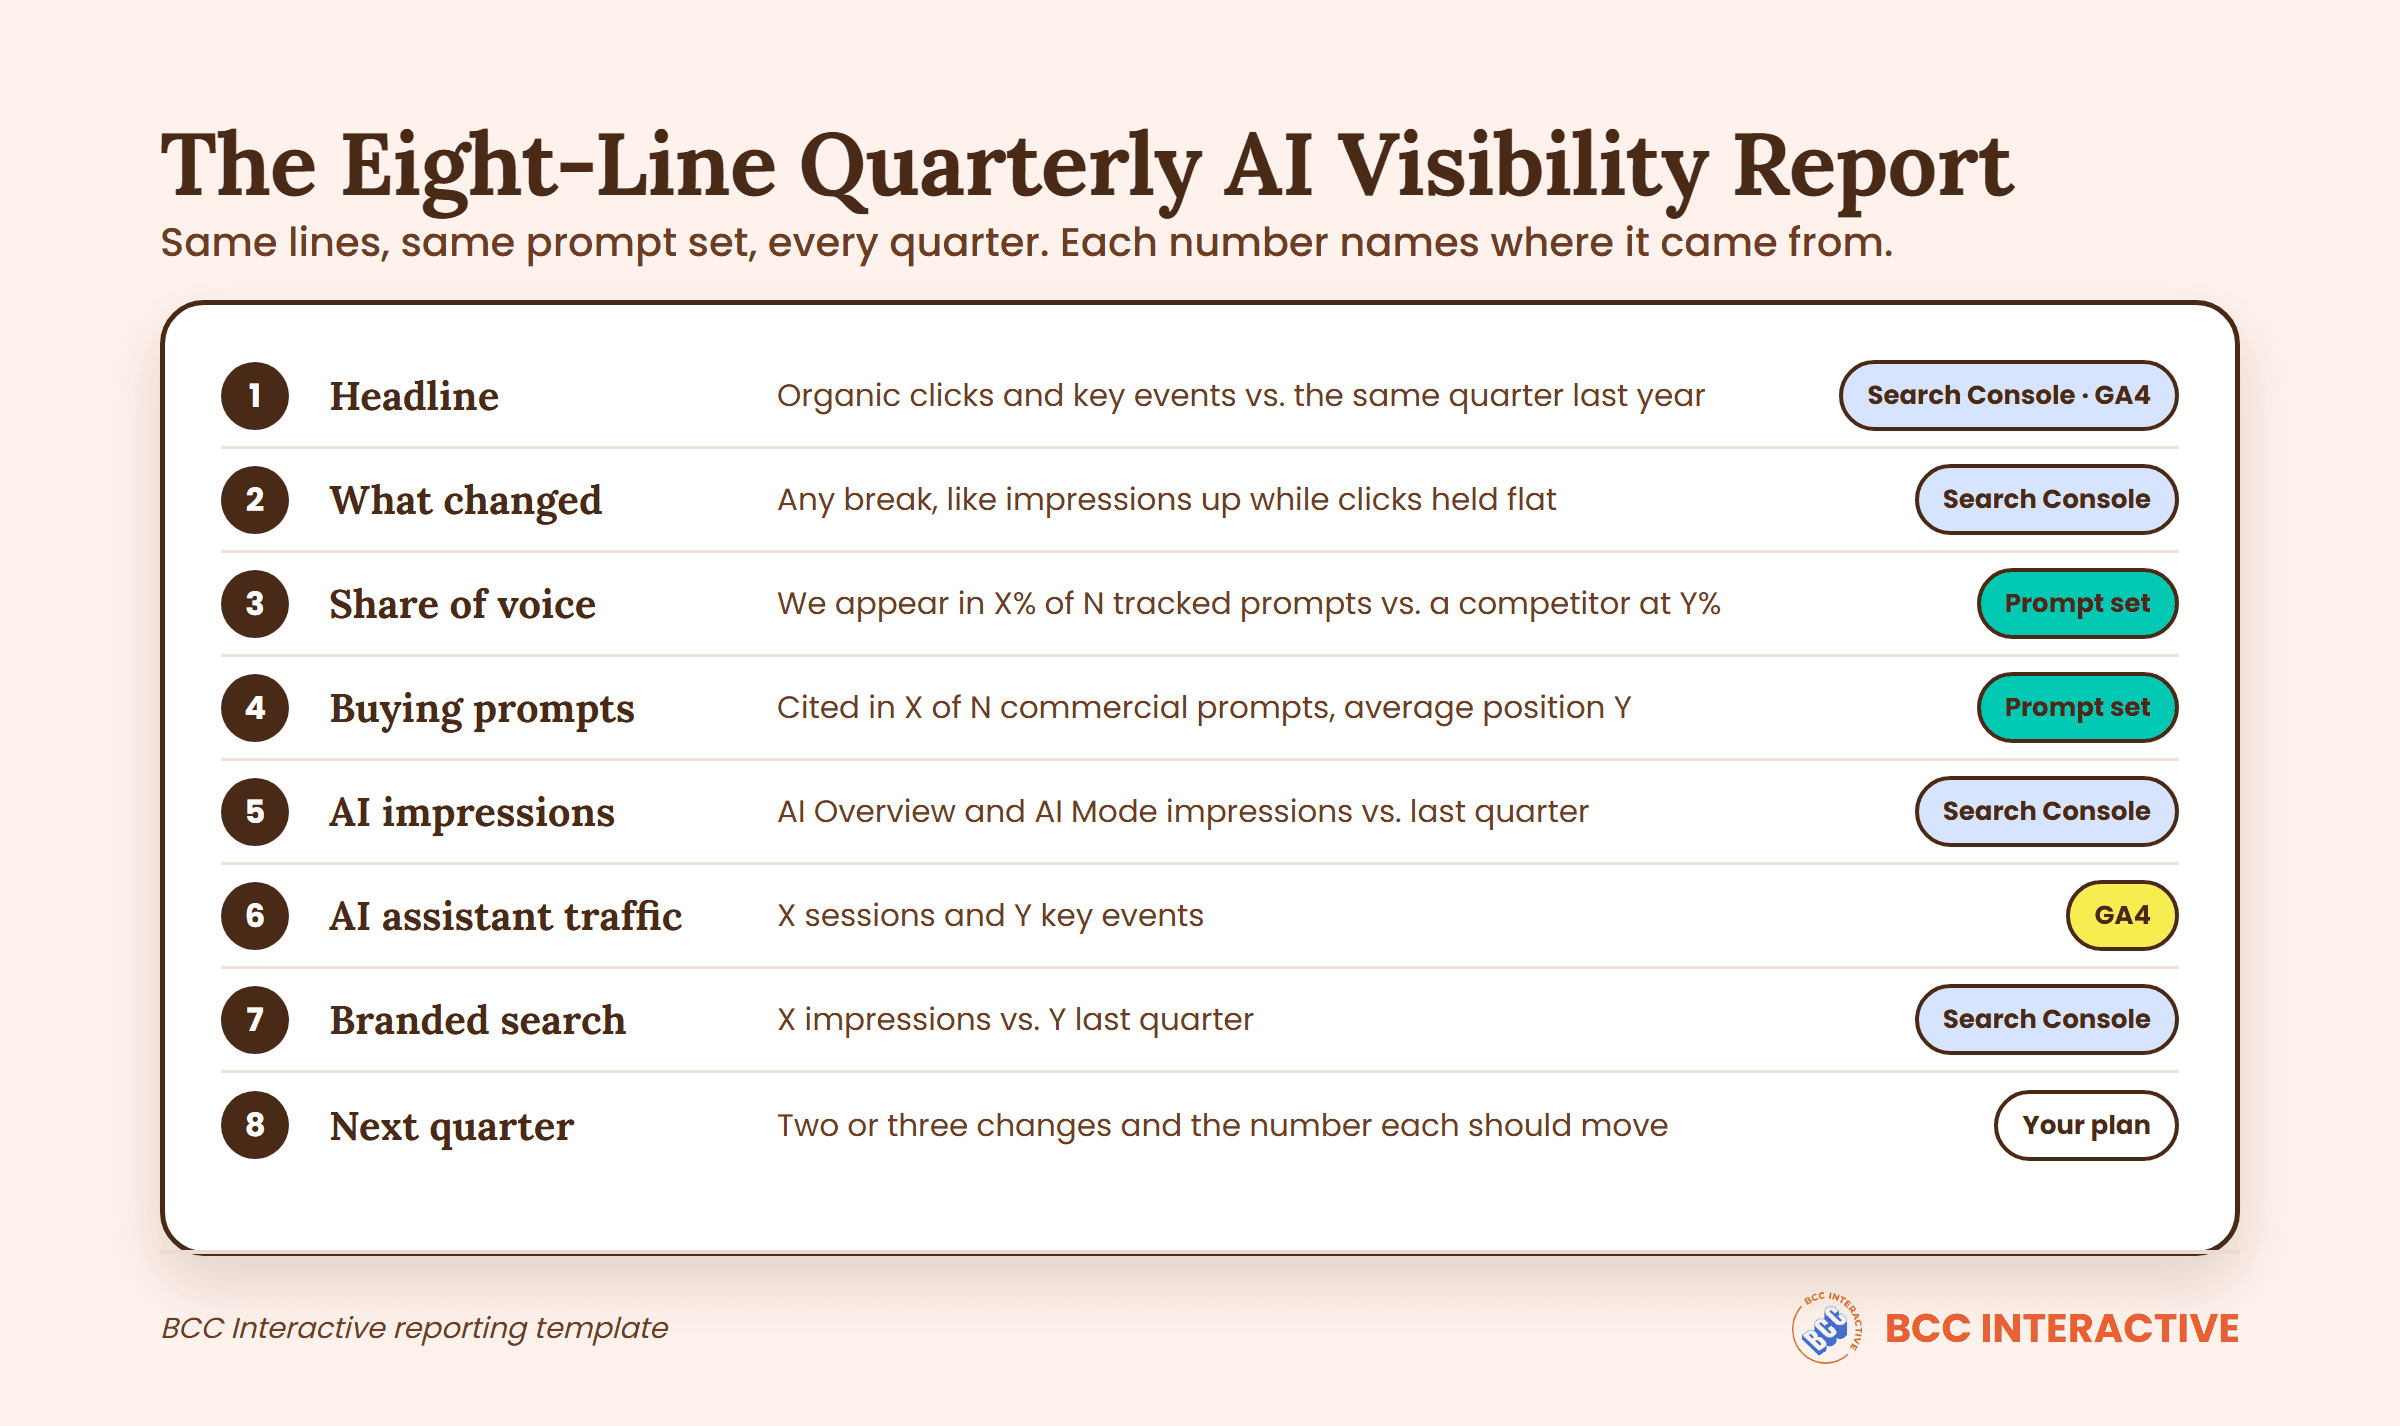
Boards want a short, repeatable set of numbers every quarter, each with a source they could check themselves. Skip the algorithm explanation. Show the same eight lines every quarter (template below), the trend against the same quarter last year, and one sentence on what changed.
Avoid putting a single visibility score from an AI visibility tracker at the top. Nobody on a board can verify it, and the score changes when the vendor changes its formula. Show the brand mentions behind it instead: whether your brand appears in the AI answer for each question your buyers ask, and how often your brand is mentioned compared with competitors.
Talking To A Client
If you’re an agency, the client’s first fear is that you stopped working. Show the work and the evidence in the same meeting: the split test, the pages that still convert, and what you’re changing. Set expectations before the next drop, not after it. A client who heard “rankings can hold while clicks fall” in the kickoff takes the March report much better.
Which Numbers Belong In An AI Visibility Report
You don’t need ten metrics. You need a few that leadership can trace back to a source. (For the full list of GEO metrics and how to collect each one, see our guide on how to measure GEO performance. This is just what goes in front of the people you report to.)
| Number | Where it comes from | What it tells leadership | Watch out for |
|---|---|---|---|
| Organic clicks | Google Search Console | Whether search still sends people | Includes clicks from AI Overviews and AI Mode; you can't separate them |
| Key events from organic and AI | GA4 | Whether search still produces business | Only as good as your conversion tracking |
| AI Overview and AI Mode impressions | Search Console generative AI report | How often Google's AI answers show your pages | Impressions only: no clicks, no CTR, no queries |
| AI Assistant sessions | GA4 AI Assistant channel | Visits from ChatGPT, Gemini, Claude and other assistants | Visits with no referrer still land in Direct |
| Branded search impressions | Search Console | Whether AI exposure sends people looking for your name | Also moves with ads, PR and seasonality |
| AI share of voice (brand mentions on a fixed prompt set) | Manual checks or an AI visibility tracking tool | How often AI answers mention your brand vs. competitors | A sample, not a census; keep the prompts fixed for a quarter |
Search Console’s generative AI report shows impressions only. Google announced it on June 3, 2026, and rolled it out to every site worldwide on August 31, 2026. It covers AI Overviews, AI Mode and generative AI in Discover, broken out by page, country, device and date. It has no clicks, no CTR and no queries. Google also says this data is included in the regular Performance report, so AI clicks are mixed into your normal totals.
GA4 now sorts AI assistant visits into their own channel. Search Engine Journal reported on May 14, 2026 that Google Analytics 4 (GA4) added an “AI Assistant” default channel with the medium “ai-assistant.” It only catches visits that carry a referrer, so some AI traffic still shows up as Direct. See our guide to Search Console and Google Analytics for how the two tools count differently.
Neither tool covers what ChatGPT or Perplexity say about you. That’s what the prompt set is for: the same 15 to 25 questions your buyers would ask, run every month across the major AI platforms they use: ChatGPT, Gemini, Perplexity and Google’s AI Overviews. For each AI response, log whether your brand is mentioned, whether it’s cited with a link, and where it lands in the answer. Different AI models pull from different sources, so a brand mention in ChatGPT tells you little about Gemini. It works as a small audit you repeat, not a one-time check. That answers the board’s “what software produces those numbers?” question too. Search Console and GA4 produce most of them for free, and a tracking tool or a spreadsheet produces the rest.
No Baseline Yet? Run The 15-Minute Check Before Your Next Report
Our free AI Visibility Playbook walks you through checking how ChatGPT, Gemini and Perplexity describe your business, who they compare you to, and where they get their information. It gives you a starting point to report against. Fixing what it finds is the work we do.
Get the free playbookThe Quarterly AI Visibility Report Template
Our GEO measurement guide has the five lines we put in a quarterly AI visibility report. For a boss or a board, we wrap them with a headline line on top and a decision line at the bottom, so the report starts with the business and ends with what happens next.
| Line | What goes in it | Source |
|---|---|---|
| 1. Headline | Organic clicks and key events this quarter vs. the same quarter last year | Search Console, GA4 |
| 2. What changed | One sentence on any structural break, such as impressions up while clicks held | Search Console, annotated |
| 3. Share of voice | We appear in X% of our [N] tracked prompts vs. [competitor] at Y% | Prompt set |
| 4. Citations on buying prompts | Cited in X of [N] commercial prompts, average position Y | Prompt set |
| 5. AI Overview and AI Mode impressions | X this quarter vs. Y last quarter | Search Console generative AI report |
| 6. AI Assistant traffic | X sessions and Y key events | GA4 AI Assistant channel |
| 7. Branded search | X impressions vs. Y last quarter | Search Console |
| 8. Next quarter | The two or three things we'll change, and the number we expect to move | Your plan |
Keep the same lines and the same prompt set every quarter. A report that changes shape each time can’t show a trend, and the trend is the whole point.
Mistakes That Make The Conversation Worse
- Leading with sitewide CTR. It falls whenever impressions inflate. You’ll explain a decline that isn’t real.
- Blaming AI without the split test. If both groups of queries lost clicks, it’s a rankings problem, and leadership will find out.
- Promising AI Overview CTR. Search Console doesn’t report clicks for AI features separately. Any report that shows “AI Overview CTR from Search Console” is showing a number Google doesn’t provide.
- Comparing adjacent 28-day windows. Slow declines hide inside them. Leave a gap.
- Making AI referral traffic the headline. It’s still a small slice of most sites’ search traffic next to traditional search. Show it, track the trend, don’t build the meeting around it.
- Changing the prompt set every month. AI answers shift constantly. If your questions shift too, you can’t tell a real change from noise.
Report The Business First, Then The Algorithm
AI Overviews really are taking clicks from a lot of informational searches. The studies agree on that much, even if they disagree on how many.
What keeps your program funded is how you report it. Prove the drop is AI with the split test. Lead with clicks and key events. Show AI impressions and citations as their own lines, each with a source. Then tell leadership what you’re changing.
If you want help building that report, or the answer engine optimization (AEO) work that improves your brand visibility in AI search, that’s what we do for B2B companies, e-commerce companies and local businesses.
Frequently Asked Questions
Most often, Google is showing your pages inside AI Overviews and AI Mode, which count as impressions, while the answer on the page means fewer people click. Confirm it by splitting your queries into ones that show an AI Overview and ones that don’t. If only the first group lost clicks, AI Overviews are the likely cause.
No. Search Console’s generative AI report shows impressions only, by page, country, device and date. Clicks from AI Overviews and AI Mode are counted, but they’re mixed into your regular Performance report totals and can’t be separated.
Most of them come from free Google tools: Search Console for clicks, branded search and AI Overview impressions, and GA4 for AI assistant traffic and key events. What ChatGPT, Gemini and Perplexity say about you comes from a fixed set of prompts you check each month, by hand or with an AI visibility tracker that tracks brand mentions across AI platforms.
Every independent study we’ve seen says yes for most non-branded, informational searches. Estimates range from about 15% (Amsive) to 58% (Ahrefs) for affected queries. Branded searches and brands cited in the AI Overview fare better, and Google says total clicks are stable without publishing the data.
Track it monthly and report it to leadership quarterly. Keep the same lines and the same prompt set each quarter so the trend means something, and compare to the same quarter last year to account for seasonality.
Only page by page, for pages ranking in the top 10. Sitewide CTR falls whenever AI features inflate impressions, so it no longer tells leadership whether SEO is working. Clicks and key events do.
Not Sure What To Put In Front Of Your Boss?
- Whether your traffic drop is AI Overviews, rankings or tracking
- Which numbers belong in your quarterly AI visibility report
- A 90-day plan to track and grow your AI visibility, with or without us
